Track your progress with dashboards and charts
# Track your progress with dashboards and charts
A dashboard is made up of a collection of easy-to-read charts and graphs that provide visual representation of filtered app data. The interactive charts and graphs on a dashboard display important data that gives you a 360-degree view of your business. (opens new window)
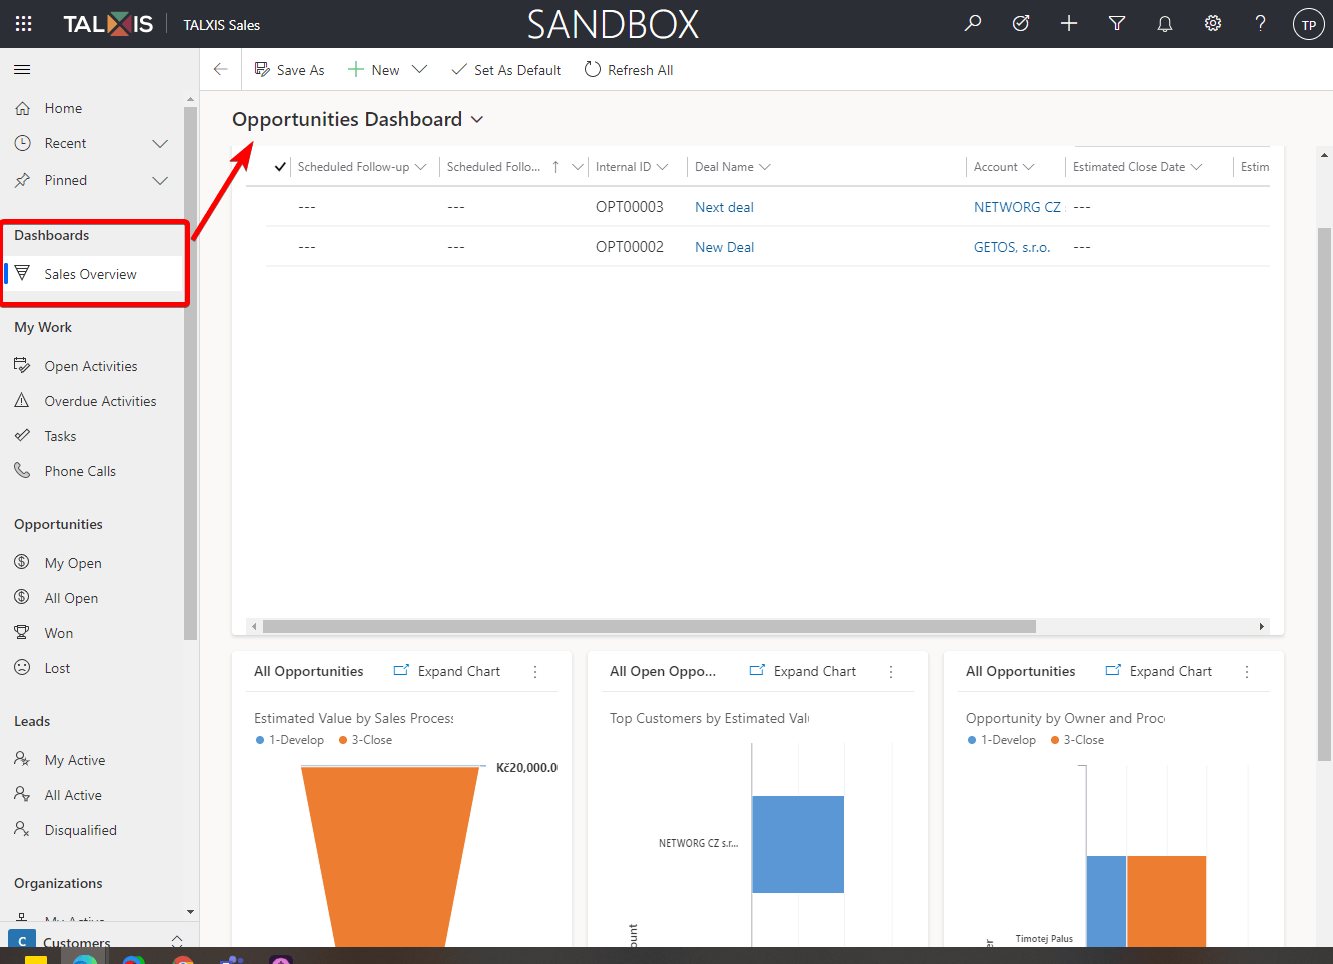
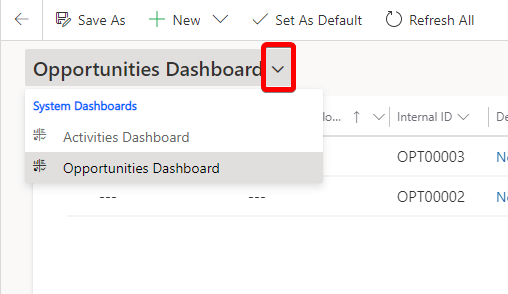
# Switch between dashboards
# Expand, refresh, and view rows in chart
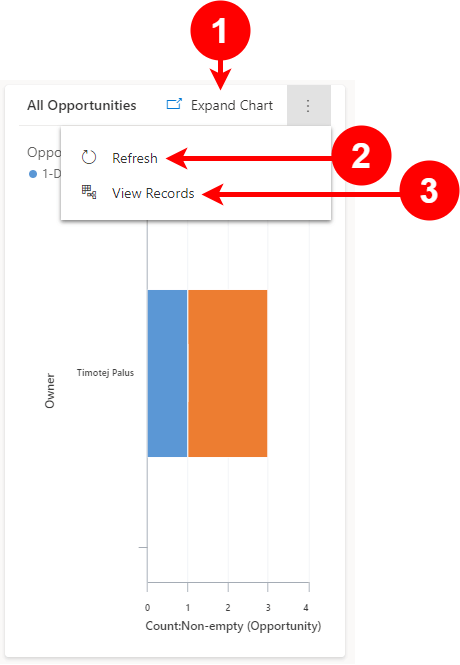
Legend:
- Expand Chart: Shows the chart in full screen mode. The chart is still interactive in expanded mode.
- Refresh: Refreshes the rows in the chart.
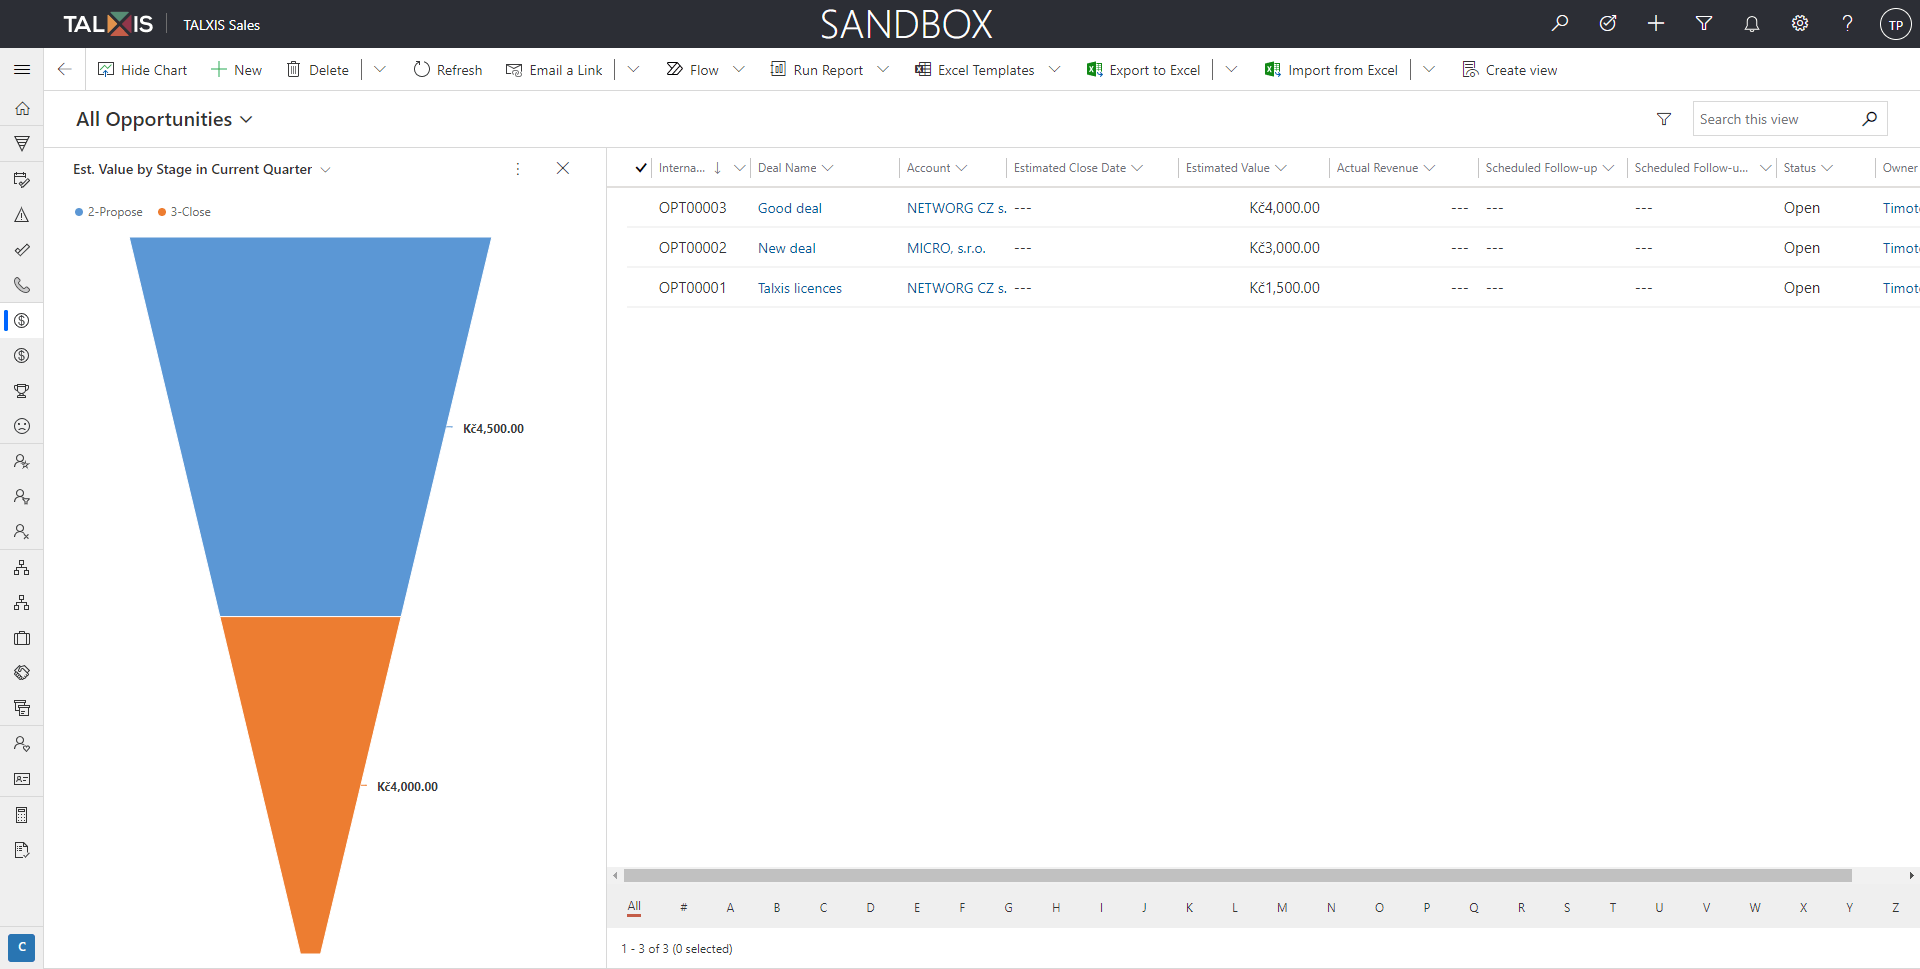
- View Rows: See the chart and the underlying rows together. This opens the chart for the corresponding rows.
After clicking on the View Rows, you will see all the records with a graph on the left.